
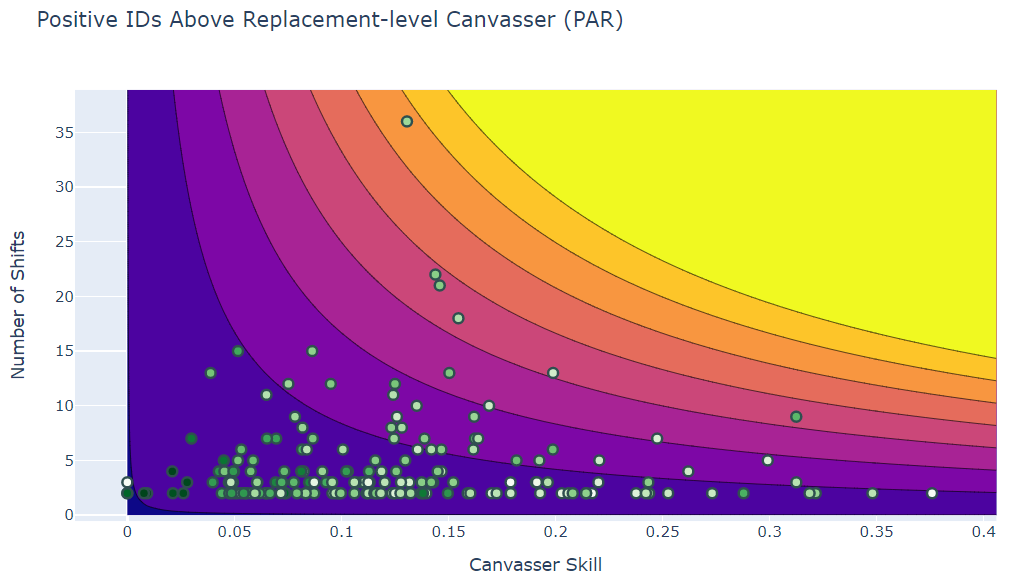
Performance Metrics for Canvassers in Campaigns
Common ways of assessing how productive canvassers have been when door knocking are:
- Counting the number of shifts they've canvassed,
- Measuring the canvasser's Contact Rate: how often they get people to answer the door,
- and Persuasion rate: the rate at which they get someone to committ to supporting their candidate.
However, we can take all three of these and combine them into a single metric: Positive IDs Above Replacement-level Canvasser, or PAR. This just means we take the total number of positive IDs they've gotten, and subtract what a "Replacement-level" Canvasser would have done in the same situations, i.e. a fresh canvasser with no experience.
A Geographical Progress tracker for campaigns made in plotly
Here you can find a tracker meant to demonstrate campaign progress over time, visualized geographically, i.e. an interactive map.
Click through to play around with the tracker in the notebook, or click on the map and get a full screen tracker.
Solving a Drift-Diffusion model via a Weighted Spectral Method in Julia
In this notebook I'll go through solving and visualizing results of a system of differential equations meant to model solute dispersion in long pipes or channels.
The system in question is from this paper, and is meant to be easier to solve and analyze compared to the full drift-diffusion equation:
\begin{eqnarray} \large u_t = \nu \Delta u - V(y,z) u_x. \end{eqnarray}Here the concentration is $u(x,y,z,t)$, and the variable $x$ is unbounded. The Diffusivity $\nu > 0$ is small. We interpret the terms on the right-hand side as the simultaneous action of diffusion and transport:

We can see that a small blob of dye or solute initially moves along with the flow in the pipe, but also diffuses slowly out towards the pipe walls. Eventually, however, the effective behavior is quite different: it diffuses rapidly down the length of the pipe. In fact, it effectively obeys this equation:
\begin{eqnarray} \large \bar{u}_t = \nu_T \bar{u}_{xx} \end{eqnarray}Here $\nu_T = \mathcal{O}(\nu^{-1})$ which is a large diffusion coefficient indicating rapid diffusion:

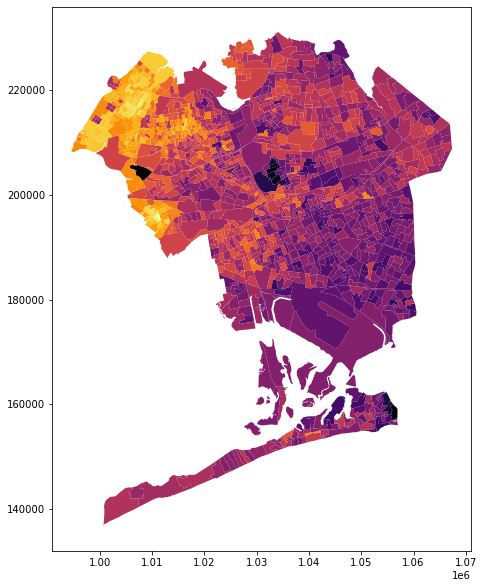
Predicting Voter Affiliation using Machine Learning Classifiers in Python
In this notebook I'll go through some work I did for a recent political campaign where we needed to predict the affiliation of voters whose ballots were invalidated. We wanted to sue to restore the validity of many ballots - but obviously we wanted to prioritize those ballots who we had good reason to think voted for our candidate.
Our candidate being young, progressive, and Latin american, we had good reason to expect that age, ethnicity, and geography (ie more left-leaning neighorhoods) were reasonable factors to influence voter affiliation. In the following map, brighter yellow areas are the strongest for our candidate relative to the primary opponent, and dark purple areas are strongest for the primary opponent relative to our candidate.
Traveling Waves for the Regularized Long-Wave Equation in Julia
In this notebook we'll use the Julia language to investigate special solutions of the Regularized Long-Wave (RLW) Equation. This equation is used to model small-amplitude, long-wavelength water waves - in particular, when wave amplitudes are much smaller than the fluid depth, which in turn is much smaller than the width of the body of water. This is a reasonable assumption in, for example, ocean waves.
The special solutions we are looking for will be Traveling Waves; that is, waves that move throughout the domain but whose shape remains fixed:
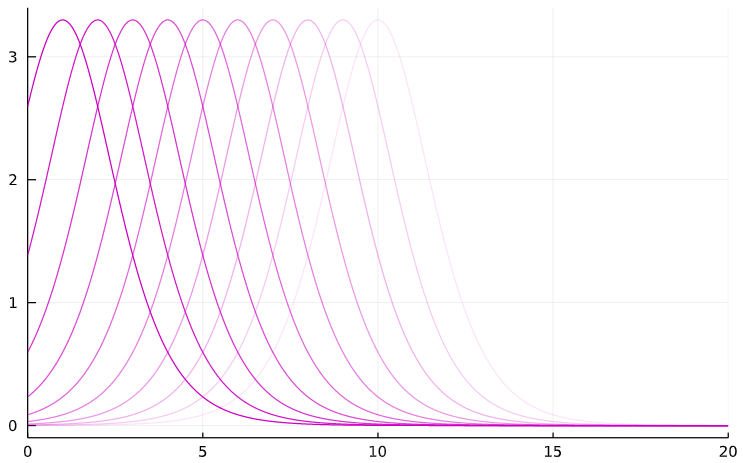
In this illustration, the more faded or transparent waves have occured further back in time.
A Machine Learning model comparison on the 1984 Congressional Voting Records Dataset
The goal of this project is to train and compare several common Supervised Machine Learning models on the 1984 Congressional Voting Records Dataset.
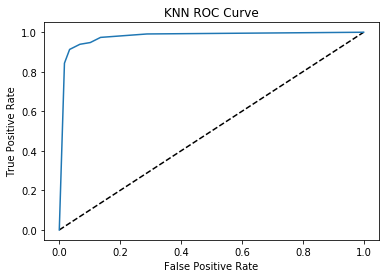
The Machine Learning models used and compared here are several classifiers: K-Nearest Neighbors (KNN), Support-Vector Machine Classifier (SVC), Logistic Regression(LogReg), and the Random Forest Classifier. I learned to use these models from Datacamp's course on Supervised Learning, including training and evaluation of model performance.
One common way to evaluate model performance is using the Receiver Operating Characteristic Curve (or ROC). We'll go into more detail later, but this gives us quick overview of what model parameters can give optimal performance in terms of true positives and false positives.
A Customer Segmentation Project
The goal of this project is to "segment" customer data from an online store into a kind of customer ranking. The dataset is the Online Retail Dataset from UCI's Machine Learning Repository. I followed this tutorial from Datacamp for this project.
Here's a link to the Jupyter Notebook for this project.
We'll rank customers according to three metrics - Recency, Frequency, and Monetary (R, F, and M), which will be combined into a single score called RFM.