A Geographical Progress tracker for campaigns made in plotly
April 28, 2021
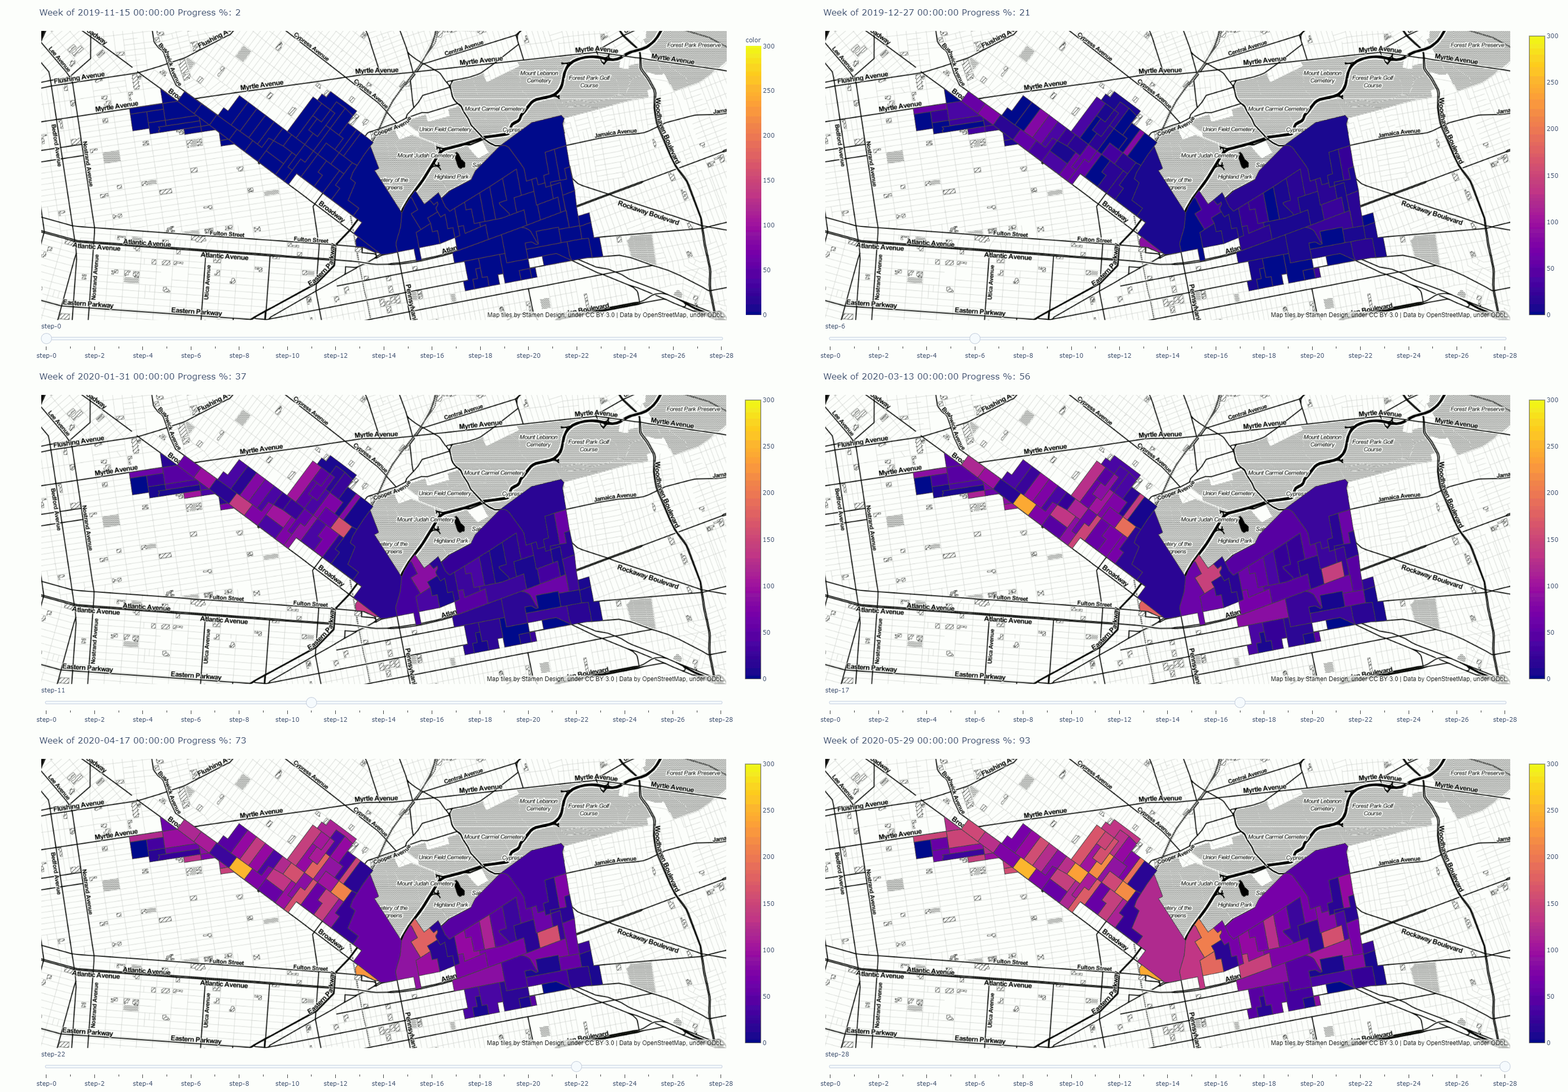
Here you can find a tracker meant to demonstrate campaign progress over time, visualized geographically, i.e. an interactive map.

Click through to play around with the tracker in the notebook, or click on the map and get a full screen tracker. Move the slider to proceed through time and see spatial changes in progress as well as overall progress at the top. The numbers displayed on the legend and the bottom-left of the hover display indicate voters contacted. Source code and labels will be posted shortly.
In [1]:
from IPython.display import IFrame
In [3]:
IFrame(src='tracker_test_new.html', width=960, height=540)
Out[3]:
In [ ]:
